
High Power Characterization of Ultrasonic Transducers - Four Methods You Need to Know About
Husain Shekhani • February 3, 2020
The need for high power measurements is real
The tool you are using to characterize ultrasonic transducers is the impedance analyzer (or network analyzer). However, the excitation power of this piece of test equipment is on the order of mW, while power ultrasonic transducers operate from 1W to 100W, and even upwards of 1kW for some applications.
Non-linearity both at the microscopic (eg material properties) and macroscopic level (eg component interaction) cause drastic differences between impedance analyzer testing and high power performance - for example, the mechanical quality factor and impedance can increase by an order of magnitude from lower power and high power characterization. This can result in approving transducers who exhibit good characteristics under manufacturing impedance analyzer tests, but fall extremely short when they are put to test in a real application.
Luckily, there are four ways to increase your confidence in the performance and reliability of your transducers by determining their high power performance. Don't let an unhappy customer be your final testing platform!
Four methods to determine the high power performance of your transducer
- Use the actual application/driving system
- Use an impedance analyzer with a power amplifier
- Use custom scripting program with an oscilloscope and function generator
- Use a USB oscilloscope, with advanced spectrum analysis capabilities
Method 1: Use a version of the actual application to characterize the transducer
Let's take an ultrasonic cleaning transducer as an example. The goal is to ensure the transducer will deliver adequate acoustic power to the cleaning chamber. You can verify this using a test device's drive electronics, which delivers a certain voltage to the transducer at the specified frequency. The transducer's power consumption is monitored and recorded via an external oscilloscope. If the power delivered is too high or too low, then the transducer would be considered out-of-tolerance.
Pros +
- If the transducer under test works as expected in the test device system, then it is a great indication that it will work as intended as a system component in the final assembled system
- You have all the supplies needed in-house to create the test setup
Cons -
- In this method, part to part variation will be assessed from a system level, therefore, using this method will increase variability in the measured transducer characteristics. My experience has shown up to a 100% increase in variability when using a test device to evaluate the characteristics of a transducer
- The test setup will have issues with reproducible, as the device electronics and firmware used for drive is not designed for accurate characterization
- Each transducer in a company's offering may need a different testing setup
- The test method may not readily provide necessary information about the transducer, such as resonance frequency and resonance impedance
Method 2: Adapt the impedance analyzer to work with a power amplifier
In this method, an impedance analyzer's measurement and signal connections can be hooked up to a power amplifier. An impedance analyzer has four terminals: H-CUR, H-POT, Low-CUR, L-POT. Connecting these terminals according to the figure below will allow you to drive your DUT with high power, while relying on the impedance analyzer for measurement and display.
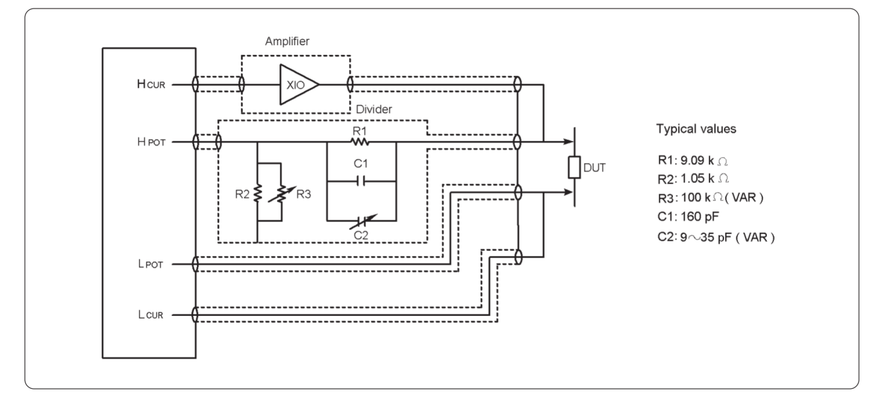
Figure: How to use an impedance analyzer for high voltage measurements (Figure 5-44 of Agilent's Impedance Analysis Handbook).
Pros +
- Impedance analyzers are common (but expensive), so you already have the basic equipment and parts needed to accomplish the measurement
- A full frequency sweep can be performed and the data output (impedance) will be presented to the user in a similar manner to the normal (low power) operation of the impedance analyzer.
- Accurate measurements are possible
Cons -
- Post-processing of impedance data may be necessary
- Using a high power amplifier in-line with your impedance analyzer may put the impedance analyzer at risk for electrical damage. Tip: Make sure you have insurance on your impedance analyzer before attempting to hook up a power amplifier.
- Excitation levels, compensation circuitry, and measurement circuitry must be carefully chosen for the specific transducer and excitation level. Changes in frequency, excitation levels, or transducers may require significant changes to the test setup
Method 3: Programming an Oscilloscope with Signal Generator
A signal generator and oscilloscope controlled via a computer scripting language such as Python, C#, or LabVIEW can be use to capture the frequency response of an ultrasonic transducer. The program will incrementally sweep the frequency across the desired band, during which the oscilloscope's measurements will be read by the computer program. Because this method uses a computer program, the user has full control on how the application functions. During my academic work, I've worked on a LabVIEW application which uses closed loop control of either voltage, current, power, or measured vibration during the frequency sweep to make for some very insightful measurements (link to research article).
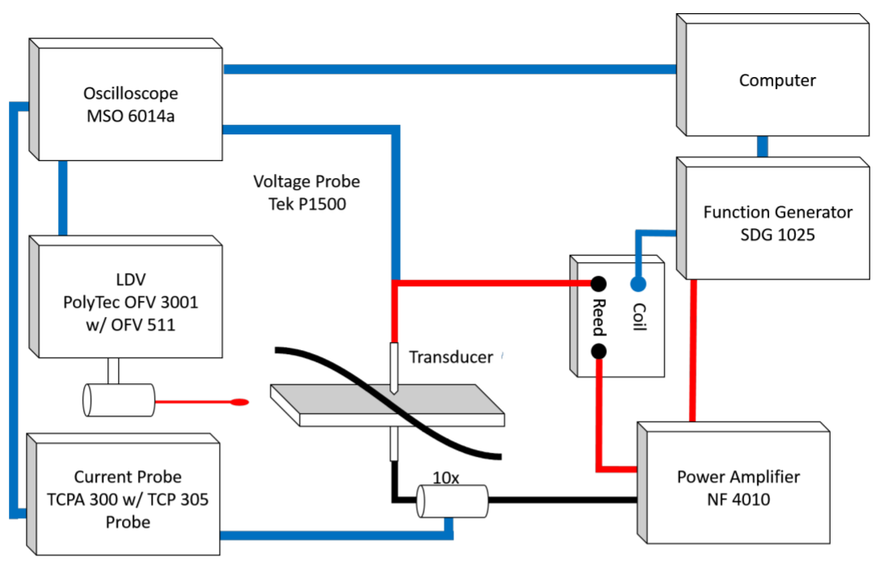
Custom computer program controls an oscilloscope and function generator to measure frequency response of a ultrasonic transducer
(my dissertation pg 68)
Pros +
- System is flexible, and can be altered according to the needs of varying types of transducers
- Closed loop control can be used to fix parameters such as output voltage, which would otherwise decrease at resonance due to the drop in impedance of the DUT
- Uses an oscilloscope and function generator, which are very common and versatile instruments
Cons -
- Custom programming is required
Method 4: USB oscilloscope (Picoscope) with power amplifier
A USB oscilloscope (specifically, a Picoscope from Pico Technologies), has a unique function in it's spectrum analyzer, It can hold the peak detected value over a frequency sweep. Therefore, it can record the frequency response of voltage and current at a DUT during a frequency sweep, to give important impedance response data. The USB oscilloscope has an AWG built-in which should be used with a power amplifier for high power excitation of your transducer. The USB oscilloscopes can be very inexpensive and still have sufficient bandwidth to handle <100kHz signals. Take a look at Picoscope 2204a)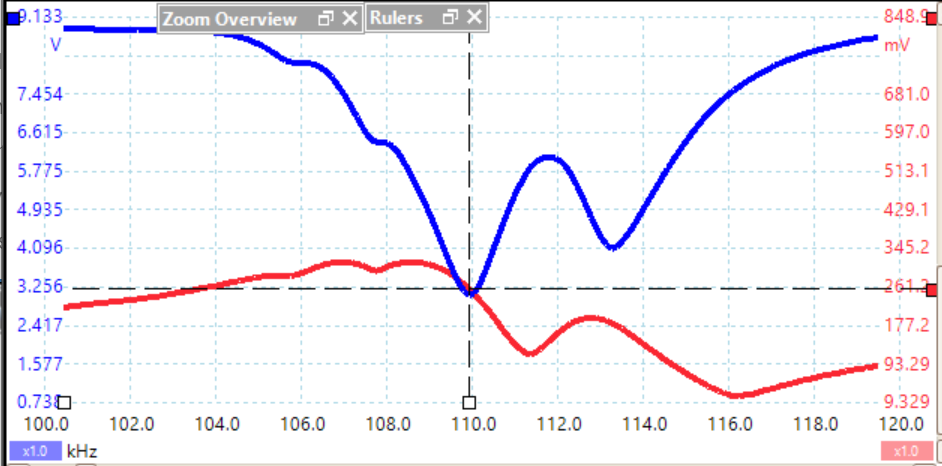
Voltage (blue) and Current (red) vs. Frequency from Picoscope desktop program. Minimum voltage signifies the DUT's lowest impedance, which is the resonance frequency
Pros +
- Does not require special circuitry and is robust to over-voltage, as current does not sink into the test equipment. Additionally, running off of a laptop, the Picoscope becomes a floating scope.
- Does not require any programming or custom software
- The frequency resolution is limited based on the sampling scheme supported by the hardware
- Optimal program settings have to be determined, especially with respect to the FFT sampling and binning settings
- The frequency resolution is limited based on the sampling scheme supported by the hardware
The winners according to price, repeatiblity, and value of the collected data
High power characterization is a must have for any manufacturing or R&D operation of ultrasonic transducers. Between all of these methods, here are my winners according to price, repeatibility, and value of the data:
If you need assistance implementing one of these methods or have other questions about this article, click here to contact me today!
Price of the test setup
- Method 4: Hands down, the Picoscope provides the most inexpensive option, while producing highly relevant measurements. The fact that a standard program can be used to administer testing is a huge thumbs up
Repeatiblity of the measurement
- Method 2 (Impedance analyzer) and Method 3 (programmed oscilloscope and function generator) provide the most repeatable measurements. That being said, Method 1 gets a good rating in this category because of the accuracy of the impedance analyzer and Method 3 gets a good rating in this category because of its ability to provide closed loop control of voltage (or another chosen output parameter)
Value of the data
- This is a tricky one. Method 2 (use of actual device/driving system) is apparently the best in this category because it is closest to the real driving conditions. That being said, it suffers from being a non-standard test method and is subject to system variation. Therefore, I suggest the best option is to use Method 2, 3, or 4, for characterization, and Method 1 for ensuring system level compatibility